Creating Interactive Reports and Dashboards in Power BI
Learn how to create interactive reports and dashboards in Power BI with our expert development services. Enhance data visualization and decision-making with Microsoft Power Apps integration.

In today’s data-driven world, the ability to visualize and interpret complex data efficiently is crucial for organizations. Power BI, a powerful business intelligence tool from Microsoft, enables users to create interactive reports and dashboards that enhance decision-making and insights. By leveraging Power BI development services and integrating with Microsoft Power Apps, businesses can unlock deeper data insights and drive operational efficiency.
The Power of Interactive Dashboards
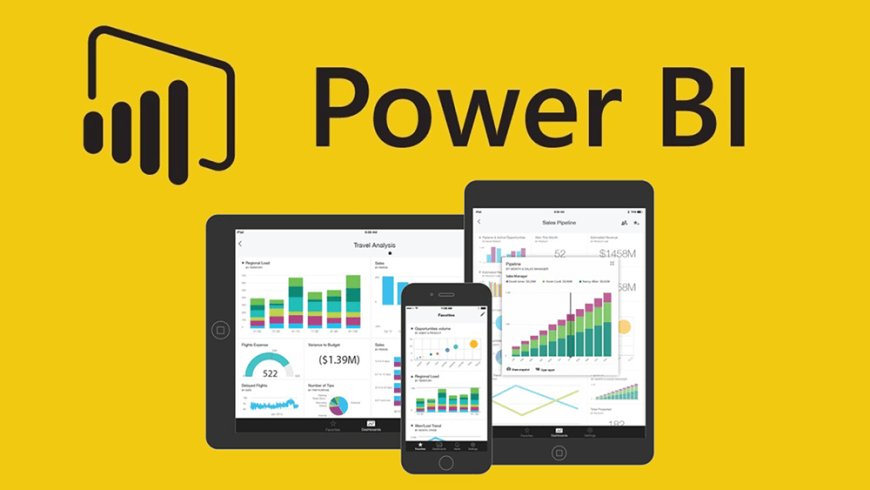
Dashboards are the heartbeat of any business intelligence strategy. They consolidate large datasets into easy-to-read visualizations like charts, graphs, and maps. Power BI enables organizations to create fully interactive dashboards, where users can filter, drill down, and explore data in real time.
-
Data visualization: Power BI offers various visualization tools, allowing businesses to represent data in a visually appealing and meaningful way. From basic bar charts to complex heat maps, users can customize their reports according to their unique needs.
-
User engagement: By integrating with Microsoft Power Apps consulting services, businesses can make their Power BI reports more interactive. This integration allows non-technical users to interact with data, adding layers of interactivity that improve data analysis and decision-making.
-
Customizable dashboards: Tailoring dashboards to meet specific needs is essential. Power BI's robust customization options allow users to modify visuals, layouts, and even the underlying data sources, ensuring the information presented is relevant to the audience.
Why Use Power BI for Interactive Reports?
Power BI's reporting capabilities go beyond simple visualization. Through its interactive features, it empowers businesses to do the following:
-
Cross-filtering and Slicers: Users can apply filters or "slicers" to drill down into specific data points. These tools are invaluable for teams looking to understand trends, spot anomalies, or focus on a particular region or time period.
-
Data Exploration: With Power BI, users can explore their datasets in a more meaningful way. Interactive reports allow users to examine underlying data, generate real-time insights, and even conduct what-if analysis to forecast future trends.
-
Mobile-Friendly Reports: Power BI’s mobile app enables businesses to access and interact with their reports on the go. This makes it easier to monitor business performance, even when away from the office.
Leveraging Microsoft Power Apps for Custom Solutions
As companies continue to integrate Power BI into their operations, the need for custom solutions has increased. Microsoft Power Apps development offers businesses the flexibility to build custom apps tailored to their specific needs. When Power Apps is combined with Power BI, organizations can:
-
Automate workflows: Power Apps can automate repetitive tasks within reports or dashboards, such as sending out automatic updates, notifications, or data collection workflows.
-
Create tailored data entry forms: Businesses can use Power Apps to build custom data entry forms that feed directly into Power BI, ensuring the data displayed is always current and relevant.
-
Develop custom applications: Power Apps allows for the creation of business-specific applications that integrate seamlessly with Power BI. This enhances the overall data ecosystem by bridging the gap between analysis and action.
Enhancing Decision-Making with Real-Time Data
Real-time data is a cornerstone of modern business intelligence. Power BI supports real-time data streaming, allowing dashboards to update as new data becomes available. This is especially critical for industries such as retail, manufacturing, and finance, where timely data can make all the difference. By utilizing Power BI development services, businesses can create custom dashboards that display real-time metrics and KPIs, helping leaders make informed decisions quickly.
The Future of Power BI: AI and Machine Learning
Power BI is evolving beyond traditional BI tools. With AI and machine learning capabilities built into the platform, businesses can leverage predictive analytics to gain deeper insights. Integrating these advanced features allows users to forecast trends, identify patterns, and make proactive decisions.
Moreover, Power BI’s AI integration enhances natural language queries, enabling users to ask questions in plain language and receive instant visual insights. This feature makes data more accessible to non-technical users, further democratizing the decision-making process.
Security and Governance
As data grows in volume and complexity, ensuring its security and governance is paramount. Power BI provides several features to secure sensitive data, including:
-
Role-based access control: Users can assign roles and permissions to ensure that only authorized personnel can view or manipulate certain data points.
-
Data encryption: Power BI encrypts data both at rest and in transit, ensuring that sensitive information remains secure.
-
Audit logs: The platform offers audit logs that track changes and data access, providing organizations with transparency and control over their data usage.
Conclusion
Interactive reports and dashboards are essential tools for modern businesses aiming to harness the power of data. Power BI, with its integration capabilities with Microsoft Power Apps and advanced reporting features, empowers organizations to build dynamic, real-time, and customized solutions. By investing in Power BI development services, businesses can elevate their data strategies, making informed decisions that drive growth and efficiency.
To take full advantage of what Power BI has to offer, consult with a Microsoft Power Apps consulting services provider. Let’s transform how your business interacts with data and create powerful, interactive dashboards tailored to your needs.
What's Your Reaction?


