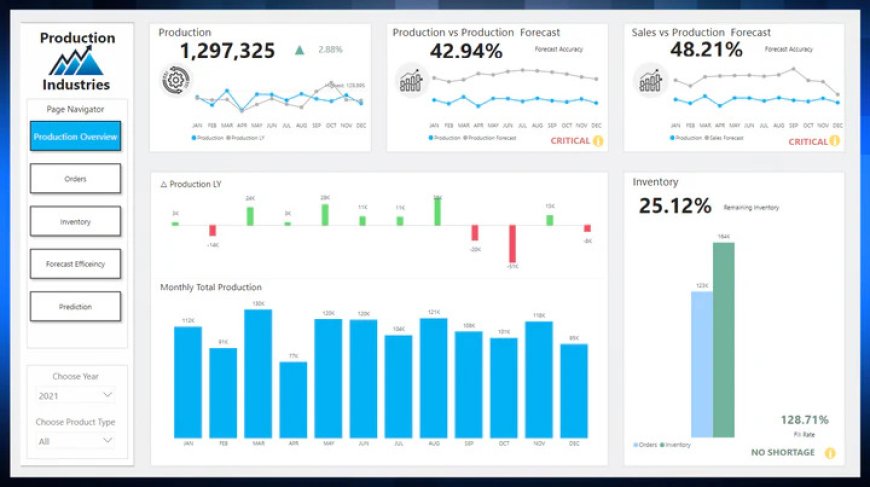
How to Create a Custom Power BI Sample Dashboard for Your Business Needs

In today's data-driven world, businesses rely on visualizing key metrics to make informed decisions. Power BI is one of the most popular tools for creating dynamic and interactive dashboards. These dashboards help business leaders easily understand performance trends, financial results, and customer insights. In this article, we'll walk through the steps on how to create a custom Power BI sample dashboard that fits your unique business needs.
Why Use a Power BI Sample Dashboard?
Before diving into the creation process, let’s understand why Power BI is such a valuable tool for businesses:
- Visual Appeal: With its powerful visualization options, Power BI helps turn raw data into actionable insights through graphs, charts, and interactive elements.
- Customization: It allows you to tailor your dashboards to meet the specific needs of your business, whether you're tracking sales, customer satisfaction, or inventory levels.
- Interactivity: Users can interact with the dashboard, filtering data and drilling down for deeper insights.
Creating a Power BI sample dashboard involves a series of steps to ensure that the end product is tailored to the needs of your business. Let’s explore the process step by step.
Step 1: Identify Key Metrics and Goals
The first step in creating a custom Power BI sample dashboard is to determine what you want to track and visualize. Some common metrics include:
- Sales Performance: Total sales, sales by region, or by product category.
- Customer Insights: Customer demographics, satisfaction scores, or feedback trends.
- Financial Metrics: Revenue, expenses, and profit margins.
- Operational Data: Inventory levels, production rates, or supply chain performance.
Ask yourself: What are the key decisions that need to be made from this data? The answer will guide you in choosing the right metrics and visualizations.
Step 2: Prepare Your Data
Power BI pulls data from various sources such as Excel files, SQL databases, cloud storage, or APIs. Once you have identified your key metrics, the next step is gathering and preparing the data. Some best practices include:
- Data Cleaning: Ensure that your data is clean and free of errors. Remove duplicates, fix formatting issues, and address missing values.
- Data Transformation: Power BI allows you to perform transformations to make your data more suitable for analysis. You can filter, aggregate, or join different datasets.
Step 3: Choose the Right Visualizations
Power BI offers a wide variety of visualizations that can help present your data in an insightful way. Here are some common options you might want to include in your Power BI sample dashboard:
- Bar and Column Charts: Ideal for comparing different categories.
- Line Charts: Perfect for tracking trends over time.
- Pie Charts: Useful for showing proportions and parts of a whole.
- Tables and Matrices: Display detailed data in a grid format.
- KPI Indicators: Highlight performance against a target.
Be mindful not to overwhelm your dashboard with too many visual elements. Select the ones that will best convey your insights and make it easier for decision-makers to interpret the data.
Step 4: Design and Layout
The layout of your Power BI sample dashboard plays a crucial role in user experience. A clean, well-organized design ensures that the dashboard is both aesthetically pleasing and functional. Keep these tips in mind:
- Consistency: Use a consistent color scheme and font style throughout the dashboard. This helps maintain a professional look.
- Clear Titles and Labels: Make sure each visualization is clearly labeled so users can easily understand what they are looking at.
- Interactive Elements: Power BI allows you to add slicers and filters, giving users the ability to interact with the data and drill down into specific segments.
Step 5: Test and Refine
Once you've built your Power BI sample dashboard, it's time to test it out. Share it with colleagues or stakeholders and gather feedback. Ask questions like:
- Are the key metrics easy to find and interpret?
- Is the dashboard interactive and engaging?
- Is the data up-to-date and accurate?
Based on the feedback, make any necessary adjustments to improve the design or functionality.
Step 6: Share and Publish
After refining your Power BI sample dashboard, you’re ready to share it with your team or stakeholders. Power BI provides several options for sharing dashboards:
- Power BI Service: You can publish your dashboard to the Power BI service and share it with others in your organization.
- Power BI Embedded: If you want to integrate the dashboard into your web application or intranet, Power BI Embedded is a great solution.
- Export Options: Power BI allows you to export the dashboard in PDF or PowerPoint format for offline viewing or presentations.
Final Thoughts
Creating a custom Power BI sample dashboard for your business needs can greatly enhance data-driven decision-making. By following these steps—defining your key metrics, preparing your data, choosing the right visualizations, designing an intuitive layout, and testing the dashboard—you can create a powerful tool that provides real-time insights into your business performance.
Power BI's flexibility and customization options make it a top choice for businesses of all sizes. Whether you're tracking sales, financial performance, or customer satisfaction, Power BI empowers you to make better, more informed decisions with ease.
What's Your Reaction?


